realtor.com Senior Economist Assessment
Writing Prompt
For all of 2024, total new residential construction completions were up +12.44% nationally compared to 2023’s annual total, with total new large-scale multifamily project completions (5+ units) showing the steepest growth at +34.7%. This significant increase in new supply is likely the result of multifamily developments initiated in 2022 when the 10-year Treasury yield started around only 2%. However, a substantial decline in completions since August 2024 suggests a cooldown may come in 2025. Additionally, the total number of permits issued in 2024 fell by -2.6% versus 2023, and housing starts declined -3.9%, while “pipeline projects” (those with authorized building permits who have not begun construction) climbed by +5.7% across all sectors, an indication that economic and political uncertainty may lead to indefinite project delays, especially in multifamily (up +10.8% year-over-year). As a result of rising completions and a backlog of delayed projects, current listings could be relatively plentiful for buyers and renters. Still, future supply may be more limited if those pending developments fail to break ground. Sellers and homeowners could see tempered price growth if completions stay strong in specific markets. Still, ongoing caution among builders may shield existing home values from oversupply risks.
In stark contrast to the rest of the nation, the Northeastern United States continues to be an outlier, not only outpacing the rest of the country in total supply added in 2024, +18% over 2023 but also exhibiting strong growth in construction starts, +9.1% over 2023, while the rest of the nation faced negative growth in total starts. Both buyers and renters in the Northeastern United States should benefit from having access to a broader inventory of residences and more stable prices. Homeowners looking to sell will likely continue to wait as mortgage rates remain high and the increase in supply depresses price appreciation.
Data Viz
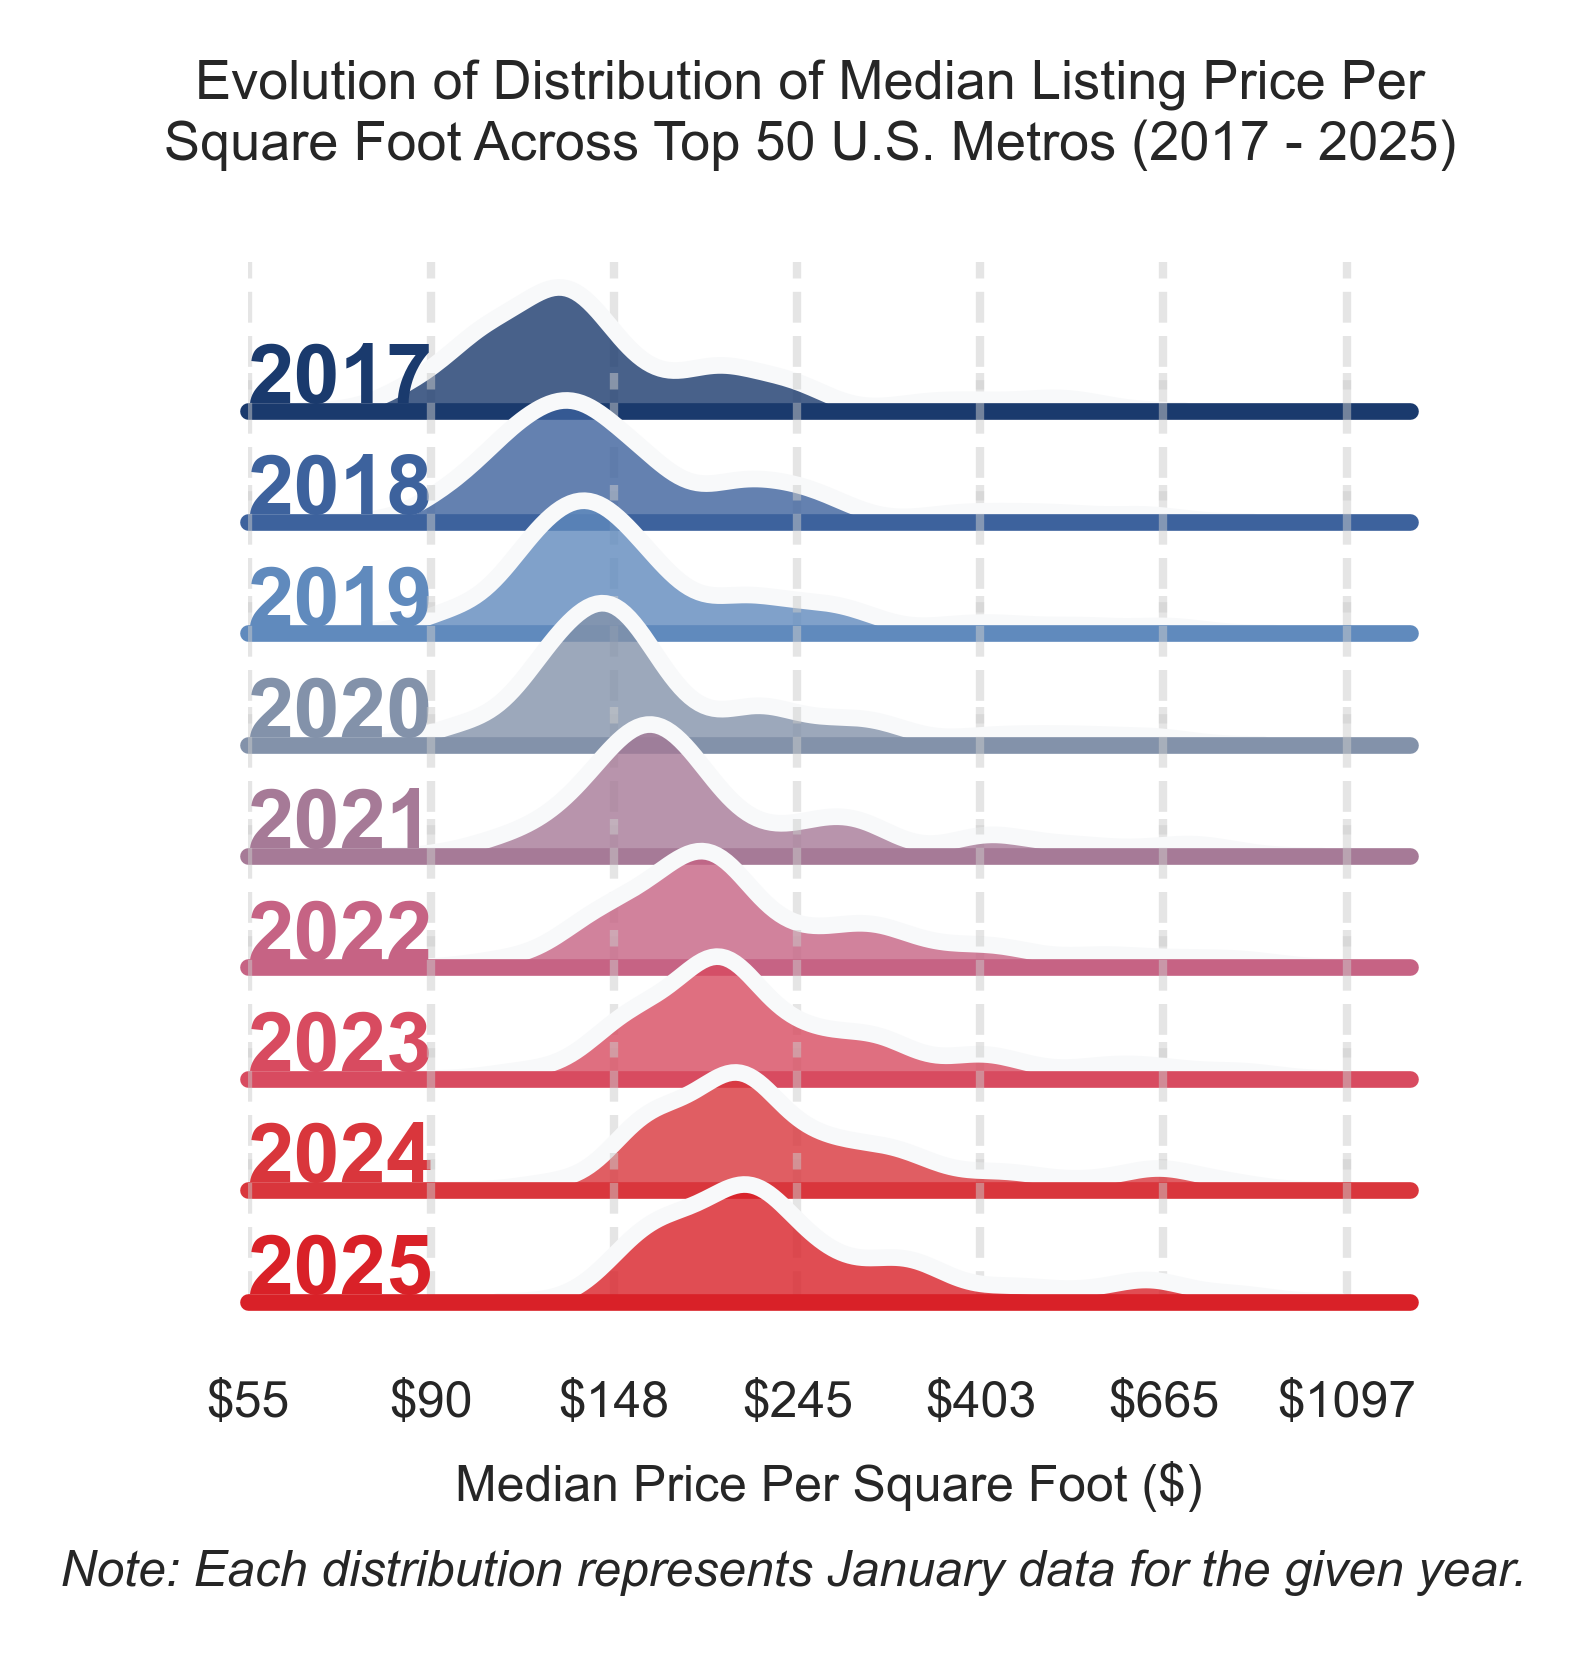
Figure 1
Takeaways
- The gap between the most expensive and cheapest housing markets has narrowed significantly since 2017, especially after the COVID-19 pandemic hit in 2020.
- The most affordable metros have seen prices rise faster, catching up to the national median. Meanwhile, price growth in the priciest markets has moderated slightly.
- More metro areas now cluster around the median price per square foot, suggesting greater price parity across cities compared to the wider extremes seen in 2017.
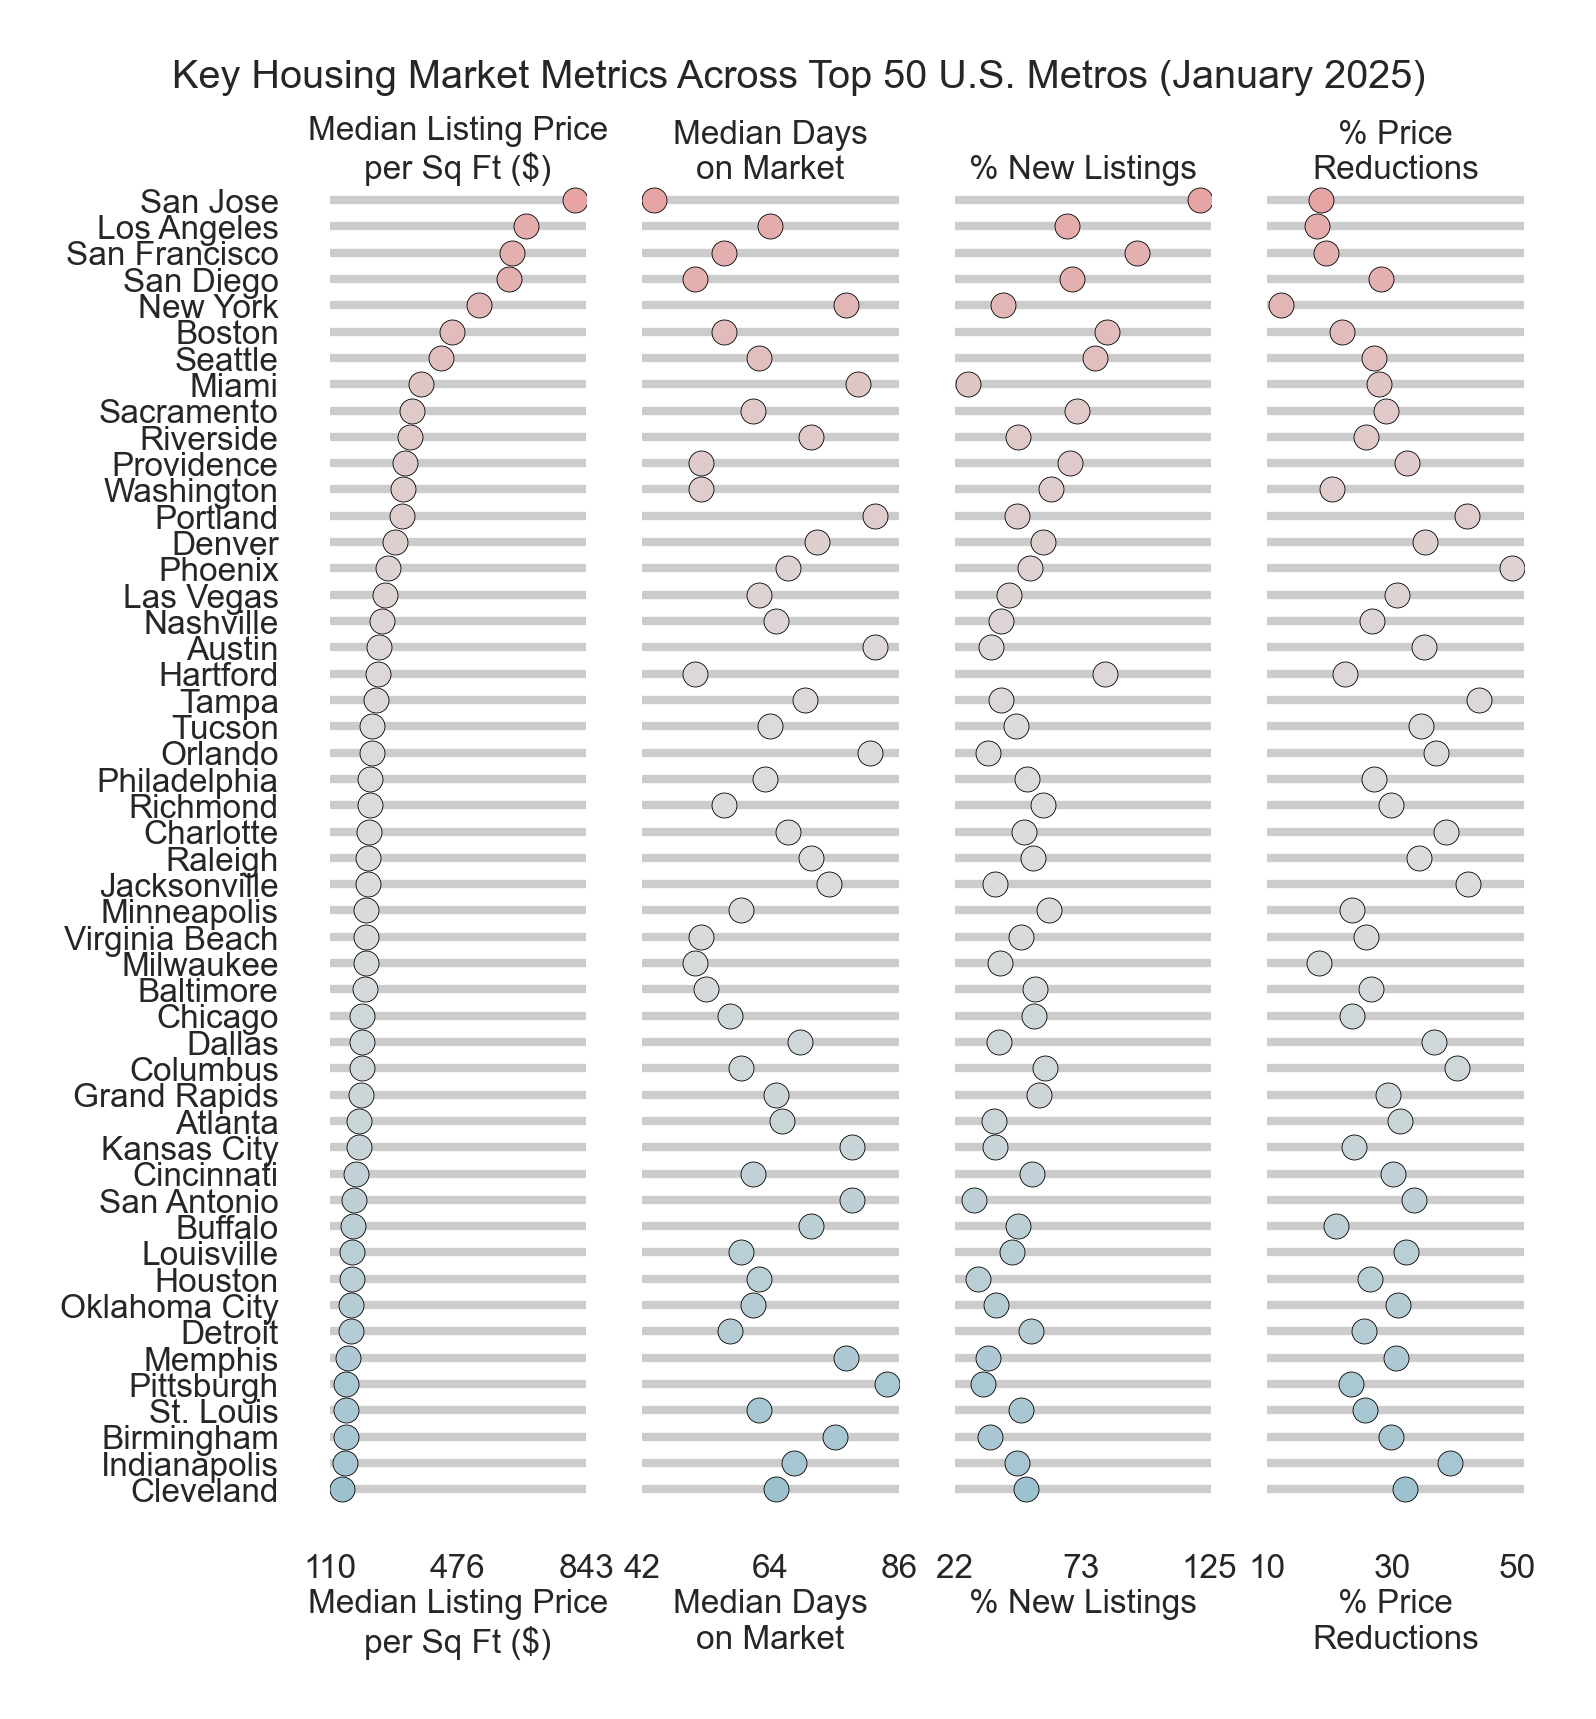
Figure 2
Takeaways
- The “superstar” metros — San Jose, LA, SF, San Diego, NYC, Boston, Seattle — continue to operate in a different league, commanding significantly higher prices per square foot than peer cities. Homes in these markets sell faster, with a more significant share of fresh listings and fewer price reductions than the rest.
- There’s a stark coastal gradient, with California and Northeast markets cluster at the top for prices. In contrast, Midwest and Southern markets like Cleveland, Indianapolis, St. Louis, and Memphis remain most affordable. The gap is striking - homes in San Jose cost upwards of 7x more per sq ft than Cleveland!
- Some popular Sun Belt metros are showing signs of cooling, with Phoenix, Las Vegas, and Orlando seeing relatively high rates of price cuts. In contrast, Rust Belt cities have stable but slow markets - fewer reductions, but homes take longer to sell. Meanwhile, Denver straddles the line between the superstar metros and the rest.
Figure 3
Takeaways
- Metros like Austin and Miami, which saw staggering 20-25% annual price growth right after COVID, are now among the hardest hit, with prices dropping 6-8% yearly since mortgage rates jumped.
- Markets like NYC and Boston that had modest post-pandemic gains have maintained positive growth even as rates climbed. LA, Richmond, Virginia Beach, Milwaukee and Memphis also eked out gains, thanks to their more tempered initial booms.
- Despite not experiencing huge post-COVID surges, San Francisco and Denver have still seen prices drop sharply as interest rates rose, bucking the trend seen in other moderately-growing markets.
Analytics Challenge
Before clarifying definitions, I would ask the reporter what they hope to get from the story. Is there a specific story they want to tell? Or are they unsure what the data will show and want to explore it first?
Then, I would clarify specifics with the reporter. I would ask:
- Do you have a specific age range for “Boomers”?
- Are you looking for a specific period in time?
- Do you want to look at sales or listings?
- Do you want to look at a specific market or nationwide?
- Does a retirement followed by a move count as “aging out”?
- Give specific examples of what it would mean to “move for an inheritance”?
- Does one receive an inheritance and then upgrade to a larger home?
- Does one inherit a home and then move to a smaller home or retirement community?
Next, I would consider what data I need to answer these questions robustly. This will allow me to evaluate issues with the data I currently have later.
- I need to know the homeowner’s age at the time of the sale.
- I need to know the date of the sale.
- I would need to know the reason for the sale.
Assuming I don’t have all the data I need, I could make some assumptions:
- Use moves at or around 65-70 years old as a proxy for moving due to retirement.
- I could estimate the number of sales due to death by separating further age ranges into 5-year buckets and then multiplying the number of sales in that age range by known mortality rates for that age range.
- If I did not have the homeowner’s age, I could back out the age by constructing a history of deed transfers for that owner. Then, I could add the years of homeownership to the average age of first homeownership at the time of first purchase.
What valuable data do I have?
interfamily_related_indicator- This could be used to infer inheritance, especially if the transaction price is unusually low.
Lastly, I would consider ways to test if my findings make sense.
- Take a look at data coverage across geographies and time periods.
- Visualize outliers.
- I don’t necessarily remove them as they may be valid and interesting.
- Corroborate my findings with any other reports or studies I can find. Are they similar?
- Come up with some sanity checks:
- Are the numbers sensible given the estimated number of Boomers in a given geography and homeownership rates?
- Given that demographic trends are stable, do the numbers align with expectations over time?
Research Oppurtunity
One of the greatest challenges facing U.S. housing market participants is anticipating how demographic shifts — significantly lower fertility rates, an aging population, and the changing nature of household formation — will reshape the demand for specific housing types over the next decade. By the 2030s, natural population growth is expected to slow significantly, with deaths outnumbering births for the first time, which places new pressures on local and national housing inventories. These changes intersect with rising remote and hybrid work arrangements and changing labor markets due to the rise of generative AI, creating uncertainty around where people will choose to reside and whether they’ll buy, rent, or pursue alternative arrangements like multi-generational living.
To thoroughly analyze and predict these shifts, I would integrate Realtor.com’s granular property listing data, covering price trends, inventory levels, and home features, with publicly available demographic data from the U.S. Census Bureau, the Bureau of Labor Statistics, and migration flows. This would allow me to examine correlations between household composition (e.g., single-person vs. family households) and property demand (e.g., number of bedrooms and amenities like home offices). Overlaying remote work indicators and local economic factors can further help isolate the effects of technology-driven relocations and the aging population on housing supply, pricing dynamics, and prospective development opportunities.
By harnessing these data sources in advanced modeling frameworks, the goal is to illuminate insights for industry participants, whether they are real estate professionals optimizing market strategies, consumers weighing long-term housing decisions, or vendors aligning their products with new consumer needs. Understanding how rising life expectancy, delayed childbearing, and the unique disruption of the 2030s demographic landscape will shape real estate demand is vital for staying competitive in the years ahead. To summarize, the biggest question facing real estate markets I’d like to address in this role is which markets, property types, and pricing segments will align most closely with emerging demographic realities, and how can we leverage that foresight to deliver targeted, data-driven solutions?